
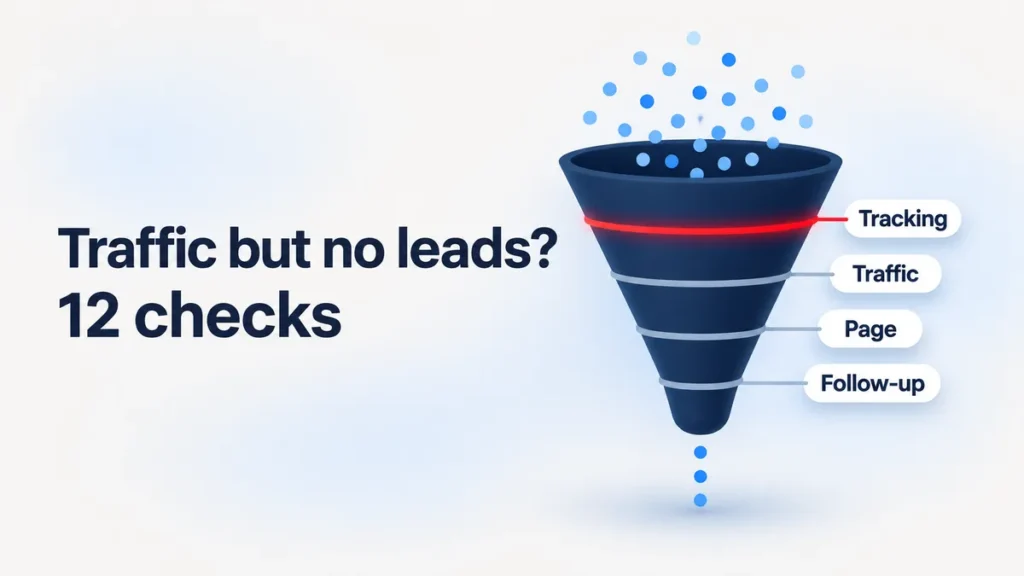
A website gets traffic but no leads for one of four reasons: GA4 misses the leads, the visitors aren’t buyers, the page doesn’t ask well, or your team replies too slowly. Check them in that order. Website lead generation breaks at the first weak link, so a redesign can’t fix a tracking gap or a slow reply.
Use our Website Lead Leak Checker to see where a mobile visitor can call, book or send an enquiry.
We run 12 checks before we change a single page. Each one ties to a GA4 or Search Console report, a number and a fix.
Four reasons traffic doesn’t turn into leads
Most lists of “why your website isn’t converting” give you 10 or 15 fixes in random order: shorter forms, clearer headlines, faster pages, more reviews. In the wrong order, those fixes waste money.
Picture a company that redesigns its service pages because leads look flat. GA4 shows the same count after launch. The old form plugin never fired a lead event, and the new one doesn’t either. The company paid for a redesign to fix a tracking bug.
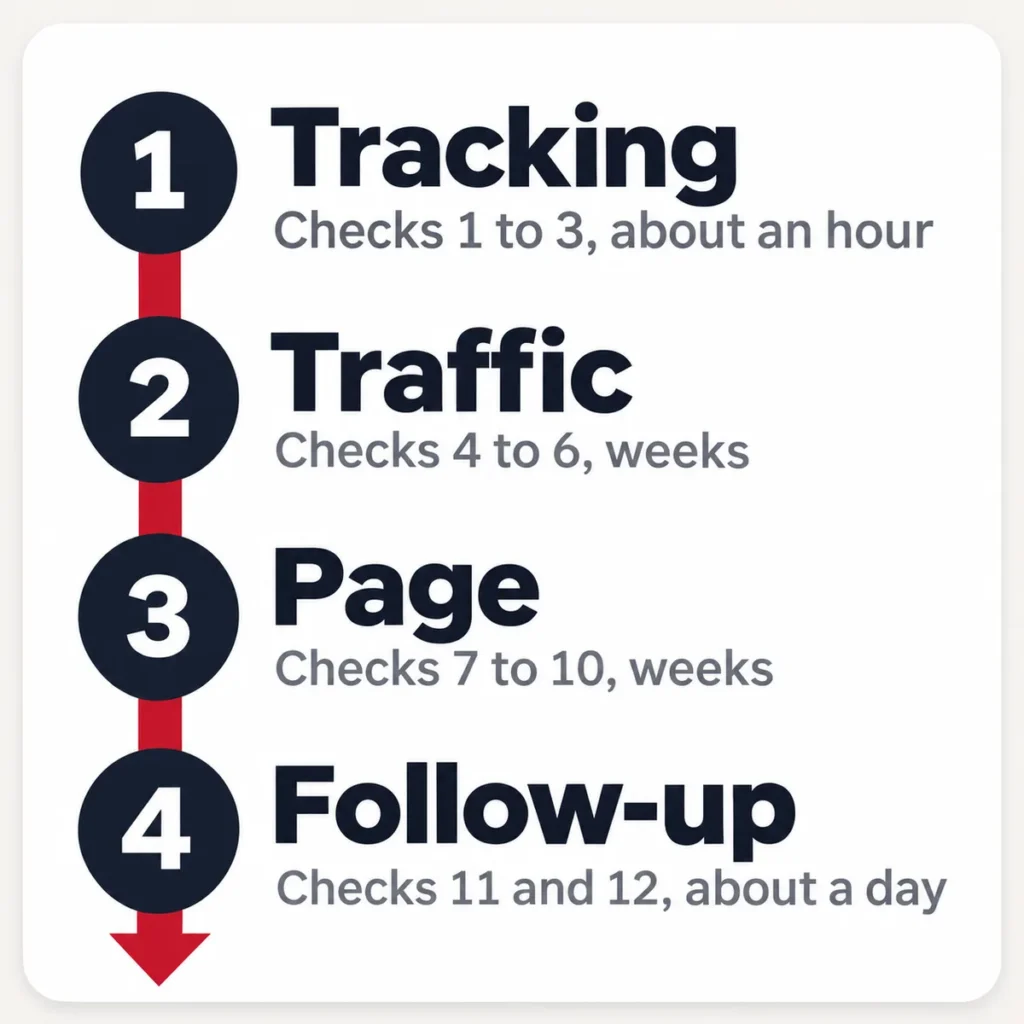
We group the 12 checks into four blocks and run them top down.
- Tracking. Does GA4 count every lead? If not, every other number lies.
- Traffic. Do the visitors match the people you sell to? Wrong country, wrong intent or a broken mobile path all look like a page problem.
- Page. Does the page say what you do in seconds, ask for one clear step and load fast?
- Follow-up. Does a person reply within the hour, and does every lead reach your CRM?
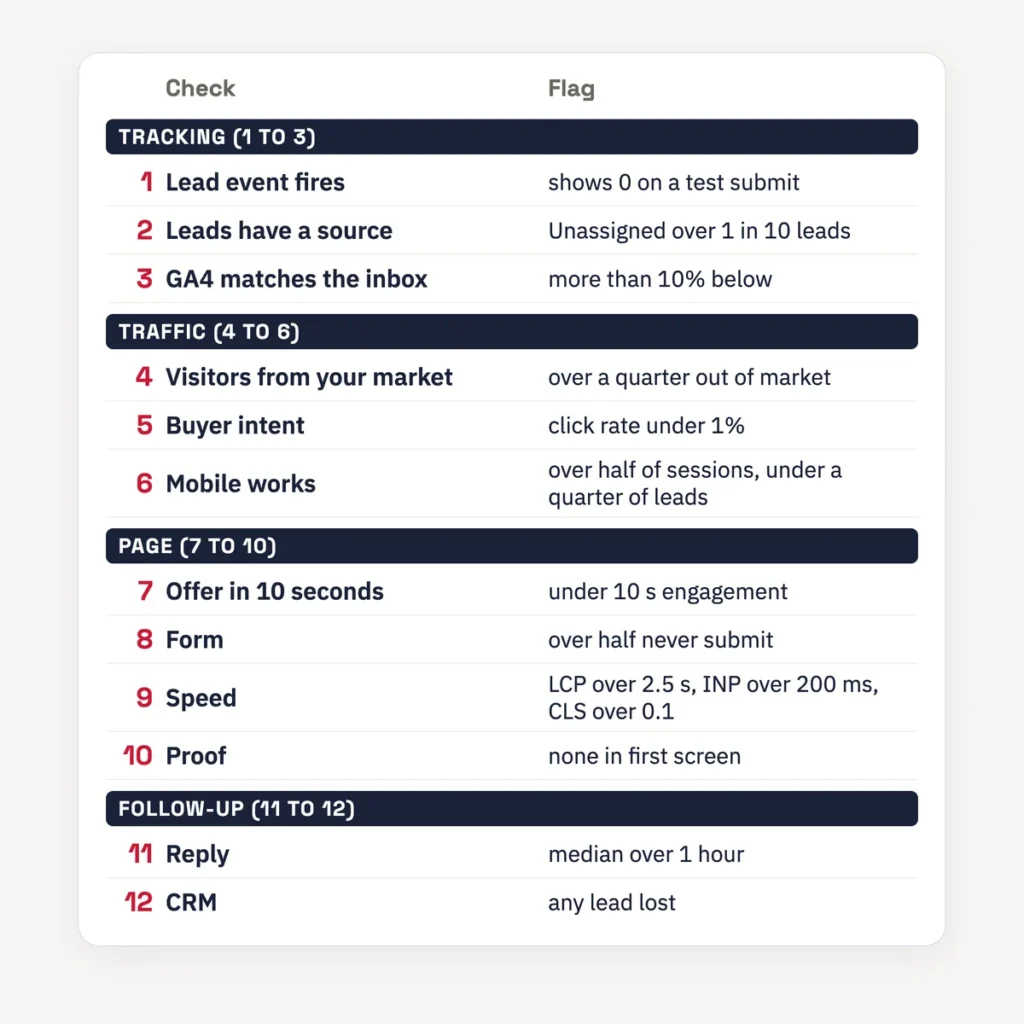
Run all 12 checks from one table
| # | Check | Report to open | Flag | Fix |
|---|---|---|---|---|
| 1 | Lead event fires | GA4 Admin > Data display > Events, plus DebugView | Your lead event shows 0 or skips DebugView on a test submit | Fire generate_lead on form success, mark it a key event |
| 2 | Leads have a source | GA4 Reports > Acquisition > Traffic acquisition, key event column | Unassigned holds more than 1 in 10 leads (our rule of thumb) | UTM tags on every link you control; check consent mode and redirects |
| 3 | GA4 matches the inbox | GA4 lead count vs. form tool, inbox and call log | GA4 sits more than 10% below the inbox (our rule of thumb) | Track calls, email clicks and every form tool |
| 4 | Visitors come from your market | GA4 Reports > User > Demographic details, Country | Over a quarter of sessions from places you don’t sell (our rule of thumb) | Write for the buyer’s market; report in-market sessions only |
| 5 | Searches show buyer intent | Search Console > Performance > Search results, your country | High impressions with click rate under 1%, or info-only queries (our rule of thumb) | Rewrite titles; build pages for buyer questions |
| 6 | Mobile works | GA4 Reports > Tech > Tech details, Device category | Mobile brings over half the sessions and under a quarter of leads (our rule of thumb) | Test the form and tap-to-call on a real phone |
| 7 | Offer lands in 10 seconds | GA4 Reports > Engagement > Landing page | Average engagement time under 10 seconds on service pages | Say who you help, the result and the next step in the first screen |
| 8 | Form doesn’t scare people off | GA4 Explore > Funnel exploration, form_start to form_submit |
More than half of starters never submit (our rule of thumb) | Cut fields to what sales needs for the first call |
| 9 | Page loads fast | Search Console > Core Web Vitals, plus PageSpeed Insights | LCP over 2.5 s, INP over 200 ms or CLS over 0.1 | Compress the hero image, defer scripts, fix layout shifts |
| 10 | Proof sits high | GA4 scroll event on service pages, plus a read of the first screen |
No named result, review or logo in the first screen | Move one named result with a number into the first screen |
| 11 | Reply within an hour | CRM or inbox: form submit to first human reply | Median reply over one hour | Instant confirmation, named owner inbox, one-hour target |
| 12 | Every lead reaches the CRM | Form tool count vs. CRM count vs. replied count | Any lead that never reaches the CRM or gets a reply | Connect the form to the CRM; send lead stages back to GA4 |
Make sure GA4 counts your leads
Checks 1 to 3 decide whether you can trust the other nine.
Check 1: the lead event fires
Open GA4 Admin, then Events under Data display, and find your lead event. Google’s recommended name is generate_lead, which it describes as a user who “submits a form online or submits information offline” (Google Analytics Help, Recommended events).
Then open DebugView (Admin > Data display > DebugView), turn on Tag Assistant and submit a test form. DebugView lists events in real time (Google Analytics Help, DebugView). If the event doesn’t show, your forms send leads to your inbox and nothing to GA4.
Mark the event as a key event. A standard property allows up to 30 key events, and a new one can take up to 24 hours to appear in standard reports (Google Analytics Help, Key events). Site rebuilds and new form plugins often drop this event, so rerun the test after every launch.
Check 2: leads land in a real channel
Open Reports > Acquisition > Traffic acquisition and set the key events column to your lead event. Read the Unassigned row. Google defines it this way: “Unassigned is the value Analytics uses when there are no other channel rules that match the event data” (Google Analytics Help, Default channel group).
Those leads happened. GA4 just can’t say where they came from. Our rule of thumb: if Unassigned holds more than 1 in 10 leads, fix tagging before you judge any channel. Links without UTM tags, redirects that strip the source and consent banners cause most of it. When a visitor denies consent, Google’s tags send cookieless pings, and GA4 uses them for modeling to fill gaps (Google Analytics Help, Consent mode). The count can survive while the source disappears.
Turn on GA4’s AI Assistant channel too. It groups visits from ChatGPT, Gemini, Copilot and similar tools. Our guide to GA4’s AI assistant channel shows the setup.
Check 3: GA4 matches your inbox
Count the leads in your form tool, sales inbox and call log for the last 28 days. Compare that total with GA4’s lead count for the same dates. Our rule of thumb: a gap above 10% means GA4 misses a lead source. Calls, direct emails and a second form tool cause most of it.
Track phone clicks and email clicks as events, and put every form tool behind the same tag. Our 90-day lead tracking cleanup walks through the full fix.
Check who your visitors are
A page can look broken when the wrong people read it.
Check 4: visitors come from your market
Open Reports > User > User attributes > Demographic details and switch to Country. Filter to Organic Search. If you sell to US companies and more than a quarter of sessions come from elsewhere, your traffic number overstates your buyers. That quarter line is our rule of thumb. Report in-market sessions as your headline number.
Check 5: the searches show buyer intent
Open Search Console > Performance > Search results and filter to your country. Search Console counts an impression each time your site appears in results, and click rate is clicks divided by impressions (Search Console Help, Performance report).
Read the top 50 queries. If most start with “what is”, “free” or “jobs”, you rank for readers who won’t buy. If a page shows thousands of impressions with a click rate under 1% (our rule of thumb), its title loses the click. Rewrite titles for buyer queries and build pages for the questions buyers ask before they call. Search Console’s newer reports also show whether AI search sends you anyone.
Check 6: mobile visitors can reach you
Open Reports > Tech > Tech details, set the dimension to Device category and add your lead event. Compare each device’s share of sessions with its share of leads. Our rule of thumb: if mobile brings more than half the sessions but under a quarter of the leads, something on the mobile path stops people. Submit the form on a real phone. Look for a submit button under a chat widget, a pop-up you can’t close or a phone number you can’t tap.
See where the page loses people
Check 7: the offer lands in 10 seconds
Open Reports > Engagement > Landing page and read average engagement time for your main service pages. Jakob Nielsen of Nielsen Norman Group found that users often leave web pages in 10 to 20 seconds. He wrote: “To gain several minutes of user attention, you must clearly communicate your value proposition within 10 seconds” (Nielsen Norman Group, 2011).
If a service page averages under 10 seconds, rewrite the first screen. Say who you help, the result you deliver and the one next step. Cut the slogan.
Check 8: the form doesn’t scare people off
GA4 enhanced measurement fires form_start the first time a user interacts with a form in a session and form_submit when they submit it (Google Analytics Help, Enhanced measurement). Build a funnel exploration with those two steps.
Our rule of thumb: if more than half of form starters never submit, the form asks too much. Cut it to what sales needs for the first call. Name, work email, company and one question usually cover it. Drop a required phone field if email works.
Check 9: the page loads fast
Open Search Console > Core Web Vitals, then run your top landing page through PageSpeed Insights. Google’s web.dev team sets the “good” lines at Largest Contentful Paint within 2.5 seconds, Interaction to Next Paint at 200 milliseconds or less and Cumulative Layout Shift at 0.1 or less. It measures each at the 75th percentile of page loads on mobile and desktop (web.dev, Web Vitals).
Three culprits slow most pages: an oversized hero image, a chat or tag script that loads first and a banner that pushes content down. Fix those before you buy a faster host.
Check 10: proof sits in the first screen
GA4’s scroll event fires when a visitor reaches 90% of the page depth (Google Analytics Help, Enhanced measurement). Compare scroll counts with page views on your service pages. If few visitors reach the bottom and your case studies sit there, most buyers never see them.
Read the first screen of each service page. If it has no named result, review or logo, move one named result with a number into it. For deeper page work, see how we run CRO and experience design tests.
Answer every lead within an hour
Check 11: measure your speed to lead
Pull the last 30 form leads from your CRM or inbox. For each, note the time from submit to the first reply from a person. Take the median.
In a Harvard Business Review study, James Oldroyd, Kristina McElheran and David Elkington audited 2,241 US companies. Only 37% replied to a web lead within an hour. Among those that replied, the average reply took 42 hours. Firms that replied within an hour were nearly seven times as likely to qualify the lead as firms that waited even an hour longer. They were over 60 times as likely as firms that waited 24 hours or more (Harvard Business Review, 2011; figures from CustomerThink’s summary). The study dates from 2011, so treat the exact multiples as a guide.
Set a one-hour reply target during business hours. Send an instant confirmation email that says who will reply and when. Route each lead to one named person’s inbox. In a shared inbox, each person assumes someone else will reply.
Check 12: every lead reaches the CRM
Compare three counts for the same 28 days: leads in the form tool, leads in the CRM and leads with a reply. Any lead that drops out between counts has leaked. Connect the form straight to the CRM, and send lead stages back to GA4. Google lists qualify_lead, working_lead and close_convert_lead for this (Google Analytics Help, Recommended events). Then GA4 can show which pages bring leads that close.
What a normal B2B conversion rate looks like
The average B2B conversion rate depends on your industry and on what counts as a conversion.
First Page Sage publishes visitor-to-lead rates from its own work with B2B companies between January 2022 and August 2025. Its averages run from 1.1% for B2B SaaS and software development to 7.4% for legal services. IT and managed services sit at 1.5%, financial services at 1.9% and manufacturing at 2.2% (First Page Sage, B2B conversion rates by industry, updated September 2025).
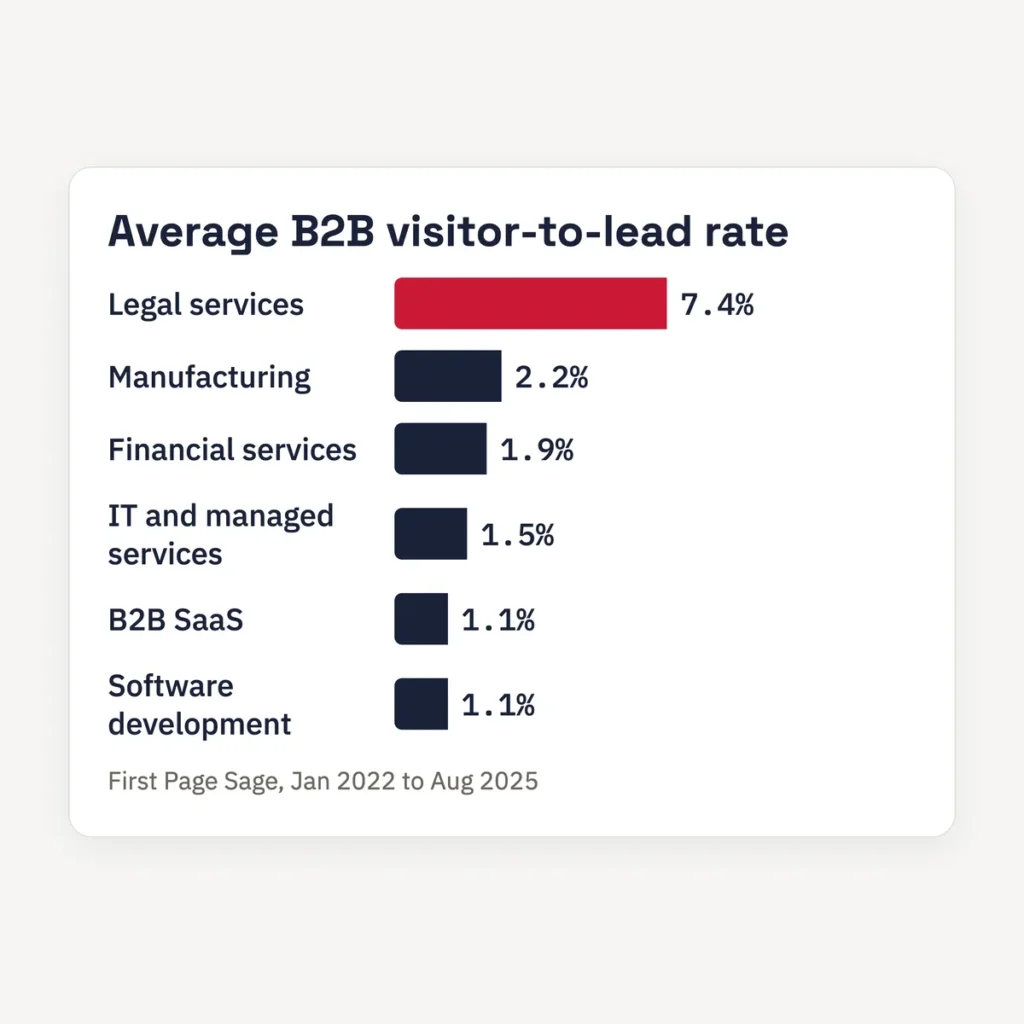
Use those numbers as a rough frame, then set your own baseline. Divide 90 days of lead events by in-market sessions, and track that rate every month. Our conversion rate calculator does the math. A rate built on the wrong traffic or a broken tag tells you nothing, so checks 1 to 6 come before any benchmark.
Fix them in this order
We check follow-up last, but we fix it second. A slow reply wastes leads you already have, and the fix takes about a day.
| Order | Block | Why it goes here | Typical effort |
|---|---|---|---|
| 1 | Tracking (checks 1 to 3) | Every later number depends on it | Hours, in GA4 and your tag setup |
| 2 | Follow-up (checks 11 and 12) | Leads you already get leak today | About a day of CRM and inbox setup |
| 3 | Traffic (checks 4 to 6) | Wrong visitors make every page look broken | Weeks of content and keyword work |
| 4 | Page (checks 7 to 10) | Page changes only show once data and traffic are right | Weeks of copy, design and testing |
A redesign touches only block 4. It leaves broken tracking, out-of-market traffic and slow replies where they were. Before you approve one, ask the team that pitched it which of the 12 checks they ran and what number they found.
Spend one hour on it Monday
Block one hour and run checks 1 to 3.
- Open GA4 Admin > Data display > Events and find your lead event. If you can’t find one, fix that first.
- Submit a test form with DebugView open and watch for the event.
- Open Traffic acquisition, set the key event to your lead event and write down the Unassigned share.
- Count the leads in your inbox for the last 28 days and compare that number with GA4.
If the numbers match and Unassigned sits under 1 in 10, move to checks 4 to 6 on Tuesday. If they don’t, our analytics, tracking and funnel audit finds the gap with your own GA4 and Search Console data. When tracking checks out and the page is the weak block, a website and CRO audit is the next step.
FAQ
Why is my website not generating leads?
Usually one of four things: GA4 doesn’t count the leads, the traffic comes from people who won’t buy, the page doesn’t make one clear ask, or the reply comes too late. Check them in that order. Start by submitting a test form with GA4 DebugView open, then compare GA4’s lead count with your inbox for the last 28 days.
What is a good conversion rate for a B2B website?
First Page Sage puts average B2B visitor-to-lead rates between 1.1% and 7.4% by industry, based on its work from January 2022 to August 2025. B2B SaaS sits at 1.1%, financial services at 1.9% and legal services at 7.4%. Use your own 90-day baseline on in-market traffic as the number you improve.
What is speed to lead?
Speed to lead is the time from a lead’s form submit to the first reply from a person. A Harvard Business Review study of 2,241 US companies found that firms replying within an hour were nearly seven times as likely to qualify the lead as firms that waited longer. Aim for a reply within one business hour.
What does Unassigned mean in GA4?
Google says Unassigned is the value Analytics uses when no channel rule matches the event data. It often means a link without UTM tags, a redirect that dropped the source or a consent setting that removed it. If Unassigned holds more than 1 in 10 of your leads, fix your tagging before you judge any channel.
How do I track form submissions in GA4?
Fire the generate_lead event when a form submits successfully, then mark it as a key event in Admin > Data display > Events. Test it in DebugView with a real submit. Enhanced measurement also collects form_start and form_submit, which you can put in a funnel exploration to see where people drop out.
Why does my website get visitors but no sales?
The same four blocks apply to a store. Confirm the purchase event fires, check where visitors come from, then test product pages for speed, clear pricing, shipping costs and reviews. Our CRO for e-commerce guide covers the store-side fixes.
You're All Set!
We have your request.
Expect a reply from our team within 24 hours. Want to talk sooner? Pick a time below.