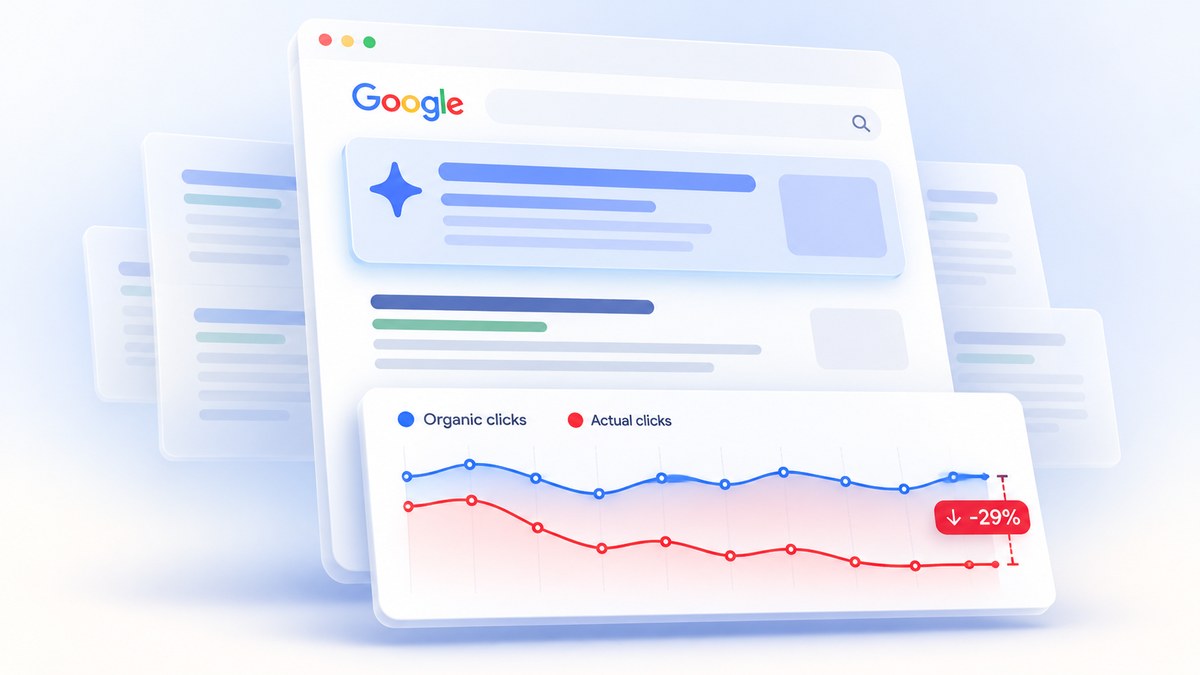
Your Search Console report shows impressions climbing month after month. Clicks sit flat, or slide a little. Google now answers more of your buyers’ questions right on the results page, and the AI Overview at the top takes clicks your pages used to get.
You can put a number on that loss in about 10 minutes. You need Search Console, GA4, an incognito window and a calculator. By the end you’ll know roughly how many clicks AI Overviews take from you each month and what those clicks are worth in dollars.
Search Console has no AI Overview filter
Google Search Console reports clicks, impressions, click-through rate and average position for every query. It has no split for AI Overviews. When your page shows up as a cited source inside an AI Overview, Google counts that as a normal impression. A click on that citation counts as a normal click. No filter, report or column tells you which of your queries showed an AI answer.
That gap makes the pattern easy to misread. Impressions rise because Google shows your page in more places, including inside AI Overviews. Clicks stay flat because fewer searchers scroll past the AI answer. Your CTR falls, and the report gives you no reason why.
Three public studies found the same click gap.
- Ahrefs, 17 April 2025. Ryan Law looked at 300,000 informational keywords. The top-ranking page got a 34.5% lower click-through rate when an AI Overview appeared.
- Pew Research Center, 22 July 2025. Pew tracked browsing data from 900 US adults in March 2025. They clicked a search result on 8% of visits that showed an AI summary, against 15% of visits without one.
- Seer Interactive, April 2026. Seer’s “AIO Impact on Google CTR: 2026 Update” covered 53 brands, 5.47 million queries and 2.43 billion impressions. Organic CTR on queries with an AI Overview rose from 1.3% in December 2025 to 2.4% in February 2026. That still trails the 3.8% CTR on queries without one.
The gap moves, and the Seer data shows it can narrow. It hasn’t closed in any of the three datasets. All three studies report averages across many sites and searchers, and your loss depends on your own query mix. The check below turns the averages into a number for your site.
The 10-minute check
Log in to Search Console and GA4 before you start. Step 3 takes the most time, so budget about four minutes for it.
Step 1: Pull your 28-day clicks from Search Console
Open Search Console and go to Performance, then Search results. Set the date range to the last 28 days. Note the Total clicks figure at the top. That’s your monthly organic clicks from Google.
We use 28 days over a calendar month because it holds exactly four weeks. Weekday and weekend swings even out, and a 31-day month doesn’t inflate the count. Write the number down.
Step 2: Tag informational queries and brand queries
Click the Queries tab and sort by clicks. Look at your top 50 queries and put each one in one of two groups.
- Brand queries contain your company name, product names or your founders’ names. Someone who types “acme payroll login” wants your site. Google usually shows it at the top with no AI answer above it.
- Informational queries ask a question or research a topic. “How to”, “what is”, “best”, “vs” and “cost of” searches all land here.
Add up the clicks from the informational group. Divide by the total clicks from all 50 queries. The result is your informational share.
You can speed this up with a filter. Add a query filter for “Query does not contain” and type your brand name. The clicks left over give you a quick non-brand figure. Non-brand clicks still include some buying searches, like “pricing” or “near me” terms, so trim the share a little if you see many of those.
Brand searches rarely trigger an AI Overview, so they stay out of the loss estimate.
Step 3: Sample 10 top informational queries in a US incognito window
Pick the 10 informational queries that bring you the most clicks. Open an incognito window in Chrome so your search history doesn’t shape the results. If you work from outside the US, set a VPN to a US location, because AI Overviews vary by country.
Search each query. Count how many show an AI Overview at the top. Seven out of 10 gives you a 70% AI Overview share.
While you’re there, note which pages each AI Overview cites. Write down whether your page appears, and which competitor pages do. You’ll use that list in the section on getting clicks back.
Ten queries make a small sample, but it works for a first estimate. If your top queries cover different topics, run 20 instead.
Step 4: Pick a drop rate from the studies
Start with 34.5% from Ahrefs. It covers 300,000 keywords and measures the top-ranking page, where most sites feel the hit first.
Pew’s numbers imply a steeper drop. A fall from 15% to 8% works out to about 47% fewer clicks. Pick that rate if your traffic leans on pure information pages, like glossaries, definitions or “what is” explainers.
If you’ve tracked your own pages, use a custom rate. Find a query where an AI Overview started showing at a date you can pin down. Compare your clicks per impression for the four weeks before and the four weeks after.
Seer’s data shifts month to month, so it makes a poor fixed rate. Treat it as a reason to rerun your check every quarter.
Step 5: Run the numbers
- Clicks exposed = monthly clicks × informational share × AI Overview share.
- Clicks lost = clicks exposed × drop rate ÷ (1 − drop rate).
- Revenue lost = clicks lost × revenue per organic visit.
Line 2 trips people up. Your Search Console clicks already reflect the drop. The exposed clicks you see are what survived after AI Overviews took their cut. So you work backward. With a 34.5% drop, the clicks you still get stand for the other 65.5% of what you would have had. Dividing by 0.655 and multiplying by 0.345 gives you the missing piece.
For revenue per organic visit, open GA4. Divide organic revenue by organic sessions for the same 28 days. If you sell through a sales team and GA4 shows no revenue, build the figure from your funnel. Multiply your visit-to-lead rate by your lead-to-close rate and your average deal value.
A worked example
Say you get 10,000 clicks a month from Google. Your Step 2 tagging shows 60% of those clicks come from informational searches. Five of your top 10 informational queries showed an AI Overview in Step 3, so your AI Overview share is 50%. You pick the 34.5% Ahrefs drop rate, and GA4 shows $2 of revenue per organic visit.
| Input or result | Value |
|---|---|
| Monthly organic clicks | 10,000 |
| Informational share | 60% |
| AI Overview share | 50% |
| Drop rate | 34.5% (Ahrefs) |
| Revenue per organic visit | $2 |
| Clicks exposed to AI Overviews | 3,000 |
| Clicks lost per month | about 1,580 |
| Revenue lost per month | $3,160 |
| Revenue lost per year | $37,924 |
10,000 clicks × 60% gives 6,000 informational clicks. Half of those queries show an AI Overview, which leaves 3,000 exposed clicks. Then 3,000 × 0.345 ÷ 0.655 comes to about 1,580 lost clicks a month.
At $2 a visit, 1,580 clicks cost you $3,160 a month. Over a year that adds up to $37,924. The yearly figure runs a few dollars above $3,160 × 12 because the math keeps the decimals on the click count.
Without AI Overviews you’d get about 11,580 clicks. You get 10,000. AI Overviews take about 14% of the organic traffic you would otherwise have.
You can also price the loss against paid search. Multiply the lost clicks by your average Google Ads CPC. That figure shows what you’d pay each month to buy the same traffic back.
If you’d rather skip the spreadsheet, our AI Overviews traffic loss calculator runs all three lines as you type. Enter your clicks, informational share, AI Overview share and revenue per visit. Pick a drop rate preset or set your own. It shows lost clicks, monthly and yearly revenue, and the cost to replace the clicks with ads. It runs in your browser and stores nothing. It sits with our other free tools for growth teams.
What the number does not tell you
The check gives you a first size for the problem. It has five limits.
It runs on averages. The Ahrefs and Pew drop rates average thousands of sites and searches. Your pages might lose more or less. A page the AI Overview cites often keeps some of its clicks. A page that sits below a long AI answer with no citation can lose more than the average.
Your sample is small. Ten queries give you a rough AI Overview share. Google also changes which queries show an AI Overview over time, and it tests different layouts. A query that showed one on Monday might not show one on Friday. Rerun Step 3 each quarter to keep the share current.
Seasons skew the 28 days. A retailer’s 28 days in late November look nothing like its 28 days in February. If your demand swings by season, compare the same 28-day window year over year instead of month to month.
Some lost clicks would never have bought. Your revenue per visit averages the whole site. Informational visitors usually convert at a lower rate than visitors who search for pricing or a product name. If GA4 lets you split revenue by landing page type, use the lower informational figure. That gives a more honest dollar number.
It covers Google only. The check models Google’s AI Overviews, because that’s where the public click studies exist. ChatGPT, Perplexity, Gemini and Google AI Mode also answer questions your pages used to answer. Their effect sits outside this estimate.
Use the result to decide whether the problem deserves a budget line. Then confirm it against your own query-level data in Search Console.
Three moves that get clicks back
Earn the citation inside the AI Overview
AI Overviews cite sources, and a cited page still shows up where the searcher looks first. Go back to the list from Step 3. For every query where the AI Overview cited a competitor and skipped you, open both pages side by side. Then rework your page.
- A direct answer in the first 100 words. Answer the query in one or two plain sentences, then back it with a number or a specific example. Move the history and background lower down.
- Clear headings that match the question. If searchers ask “how long does X take”, use that wording in an H2 and answer right under it.
- FAQ schema. Mark up your question-and-answer sections with FAQPage schema so Google can read each pair cleanly. HowTo markup suits step-by-step pages.
Check the same queries again four to six weeks after you publish the changes. Write down which ones now cite you.
Shift effort from “what is” queries to comparison and buying queries
Google answers a “what is” query in full at the top of the page, and the searcher often leaves satisfied. Comparison and buying queries work differently. Someone who searches “X vs Y for a 50-person team” or “X pricing” wants details an AI summary can’t fully give. They also sit much closer to a decision. AI Overviews tend to show less often on these searches, and the visitors they send convert better.
Look at your content plan for the next quarter. Count how many planned pieces target definitions and how many target comparisons, pricing, alternatives or “best X for Y”. If definitions win, swap some of them for buying-stage pages. Keep your best explainers updated so they can still earn citations. Put new effort where the clicks still flow.
Track clicks per impression each month on tagged informational pages
Search Console won’t flag AI Overviews for you, so build your own signal. In GA4, create a content group for your informational pages. In Search Console, filter the Pages report with a regex that matches the same URLs.
Once a month, record clicks, impressions and CTR for that group. Put them in a simple sheet next to your brand and buying pages. When CTR on the informational group falls while impressions hold, AI Overviews are the likely cause. When it rises after you rework a page, you have proof the citation work pays.
The tracking takes fifteen minutes a month. It also gives you real data for the custom drop rate in Step 4 the next time you run the check.
If the loss changes how you want to split spend between SEO and paid search, our marketing budget calculator helps you model the new split by channel.
Get the real number for your site
The 10-minute check uses averages. Our free SEO, GEO and AEO audit swaps them for your real Search Console data. We list the queries where you lose clicks to an AI answer, the pages AI Overviews cite and skip, and the pages that could win the citation. You get it within 24 hours. If you want the quick version first, run your numbers through the AI Overviews traffic loss calculator and bring the result to the audit.
FAQ
Does Google Search Console show AI Overview traffic?
No. Google counts an impression or click from an AI Overview citation as a normal impression or click. Search Console has no filter or report for AI Overviews. You have to sample your top queries by hand to see which ones show an AI answer.
What is the average AI Overview click-through rate?
The studies measure it in different ways. Seer Interactive found organic CTR of 2.4% on queries with an AI Overview in February 2026, against 3.8% on queries without one. Ahrefs found a 34.5% lower CTR for the top-ranking page when an AI Overview appeared.
How do I measure AI Overview impact on my own site?
Tag your informational pages, then track their clicks per impression in Search Console every month. Sample your top informational queries in a US incognito window to see which show an AI Overview. Compare CTR on those queries before and after the AI Overview started showing.
Which drop rate should I use for my estimate?
Start with 34.5% from Ahrefs, since it covers 300,000 keywords and measures the top result. Use about 47%, from Pew’s 15% to 8% fall, if your traffic comes mostly from pure information pages. Use your own rate once you have before-and-after data from your own queries.
Can I get traffic back from AI Overviews?
Yes, partly. Pages the AI Overview cites still earn clicks from people who read the answer first. A direct answer in the first 100 words, clear headings and FAQ schema raise your odds of a citation. Moving effort to comparison and buying queries also adds clicks that AI answers take less often.